Analyzing and Mitigating Risk
Understanding and managing digital asset risk has become crucial for organizations since digital assets are now increasingly valuable and vulnerable to attack. By identifying risks, you can take steps to mitigate those risks and protect your sensitive data.
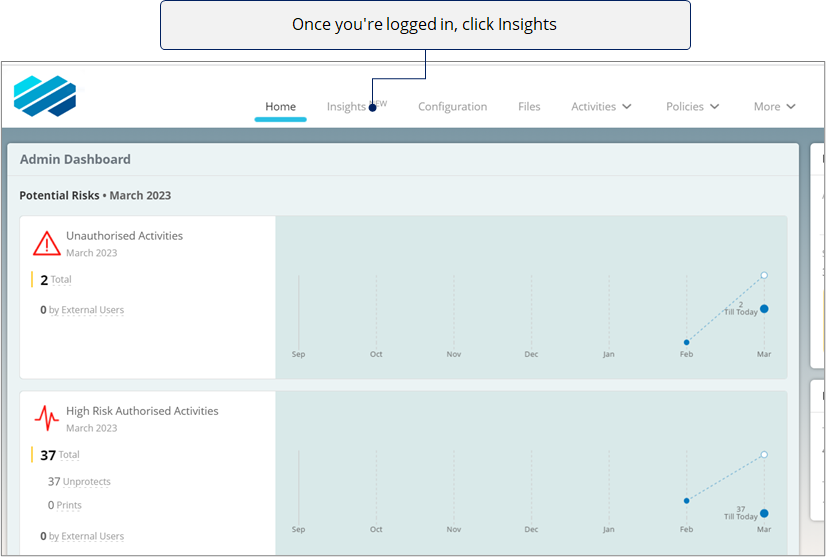
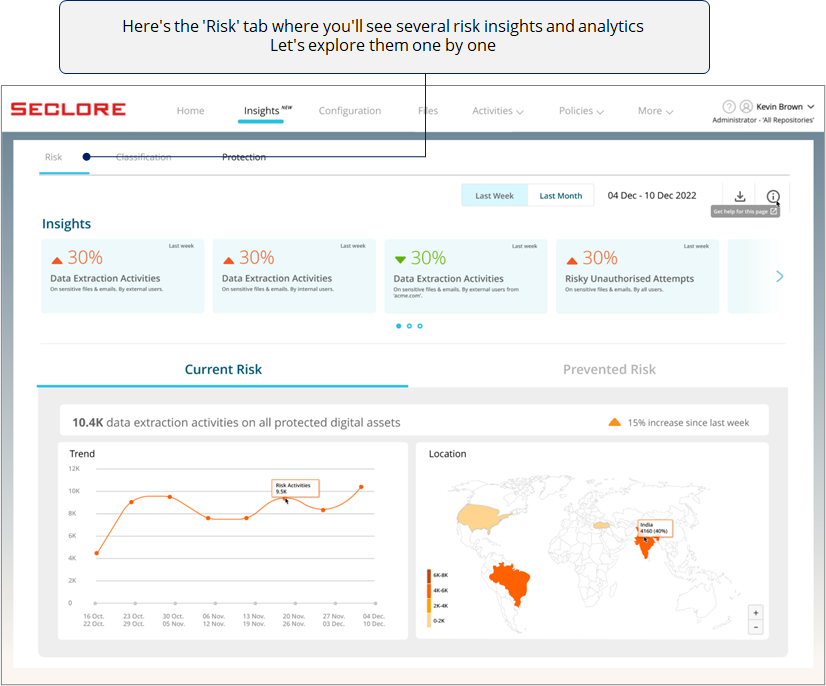
In this article, we'll explore the 'Risk' section of the Risk Analytics Dashboard.
Step-by-step
![]()
![]()
![]()
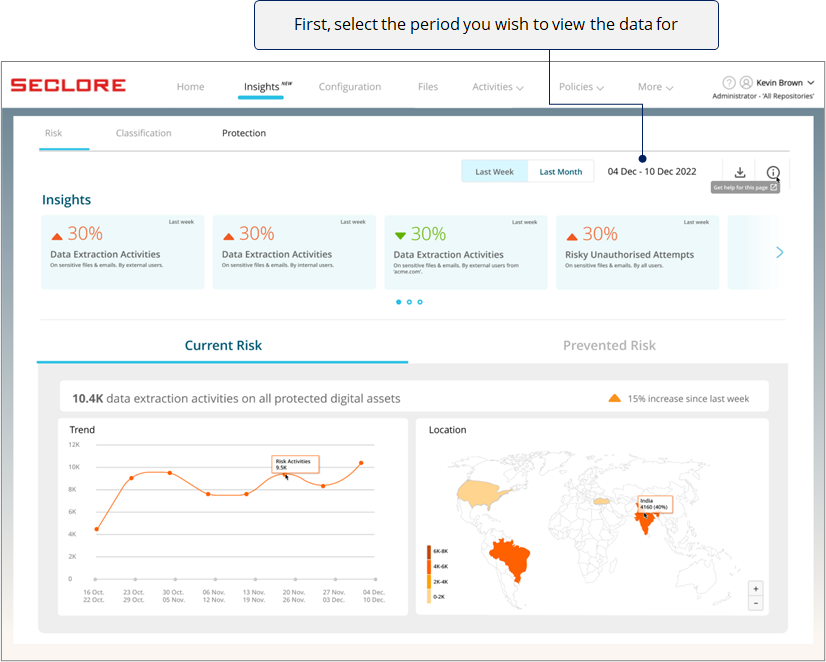
*Note that selecting 'Last Week' would show data from Sunday to Monday in the previous week.
Now, let’s explore each section. Click on the section you wish to analyze.
![]()
![]()
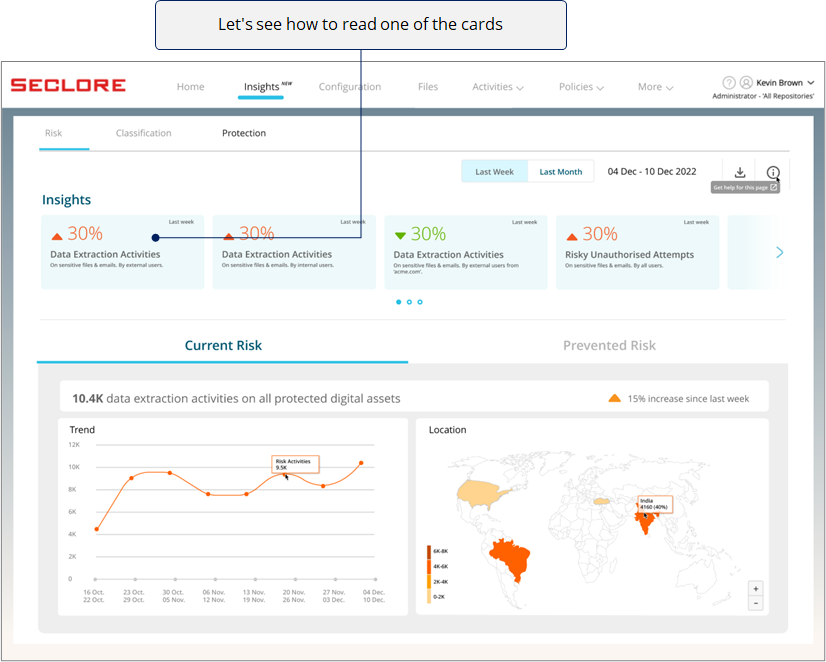
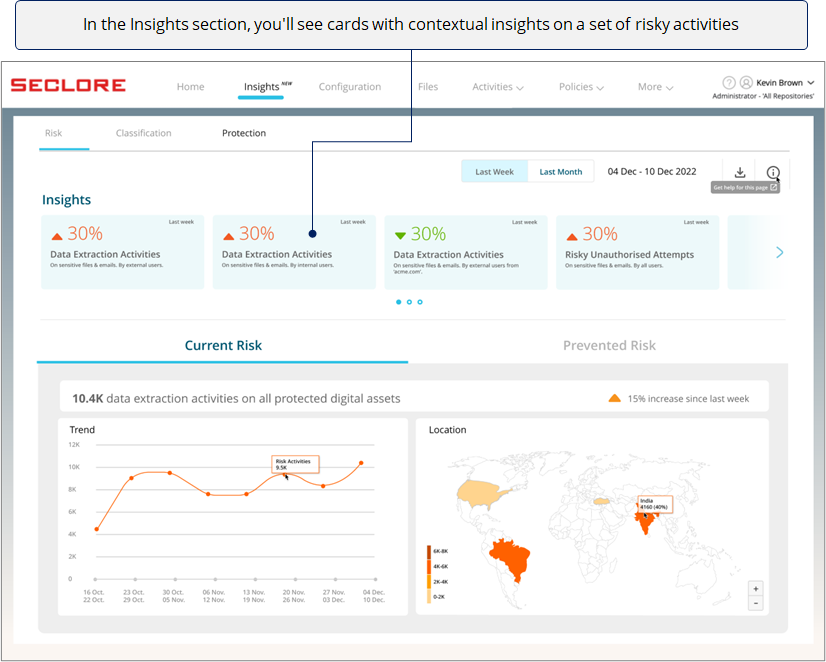
- In this card, we see that data extraction activities (where authorized users have unprotected and/or printed data) have increased by 30% last week on sensitive files and emails (files and emails classified with high sensitivity labels) by external users.
- In other words, activities where data was taken out from sensitive protected files and emails by external users have increased considerably in the last week.
- This insight could lead you to check who these external users are and how long they have been doing it. Click on the insight to view these details and an in-depth view.
- You can then check within your organization whether these data extraction activities have a valid business need and take action accordingly.
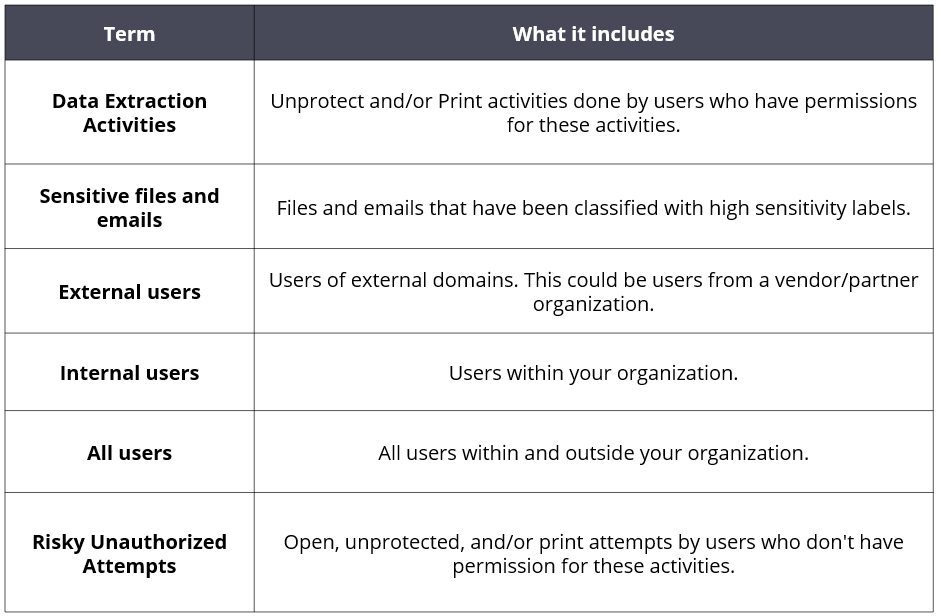
Now let's understand some terms you'd find in these cards. This will help you understand the insights in a better way.
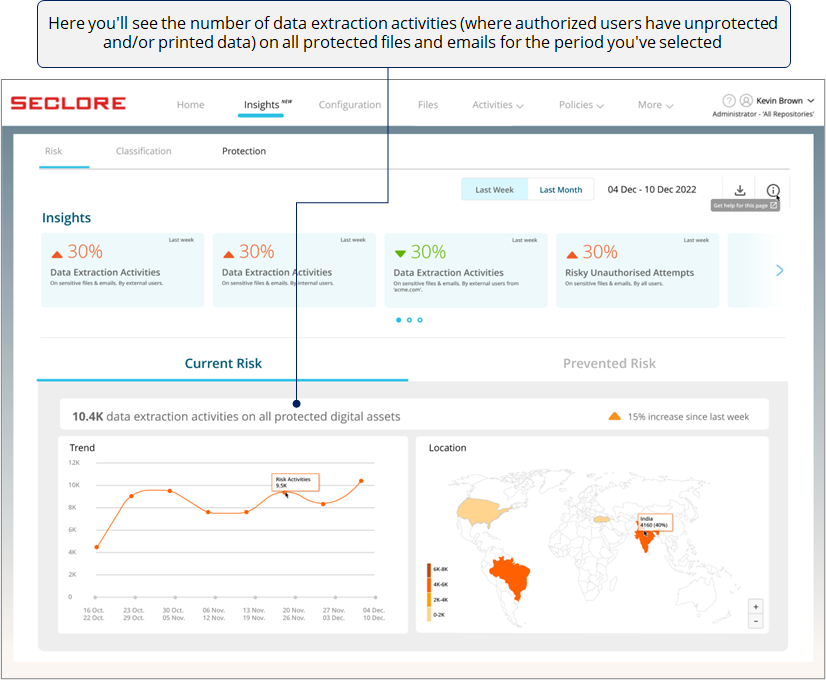
- Now, let's view the Current Risk section.
- In this section, you'll see analytics for potentially risky activities done on protected files and emails in the period you've selected.
![]()
![]()
![]()
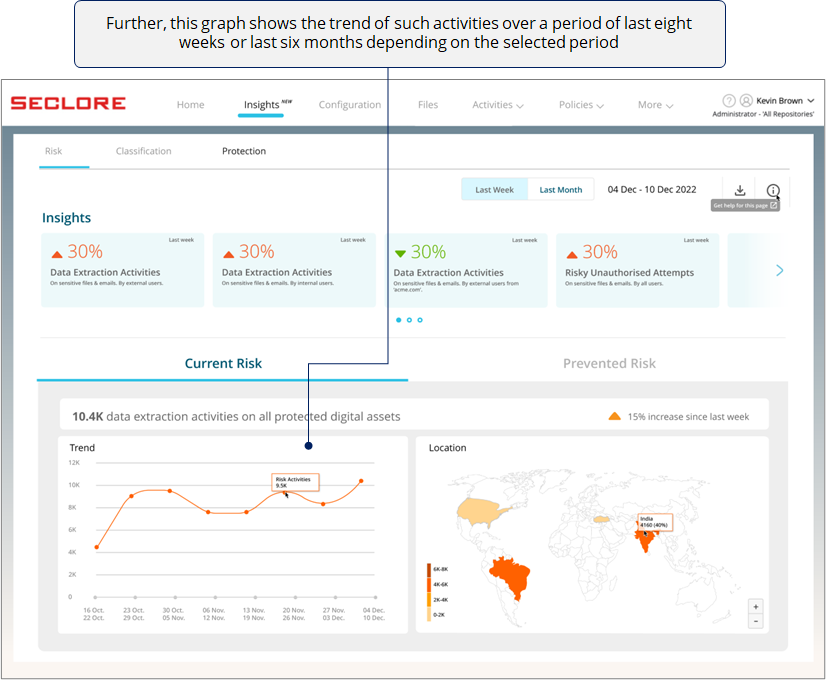
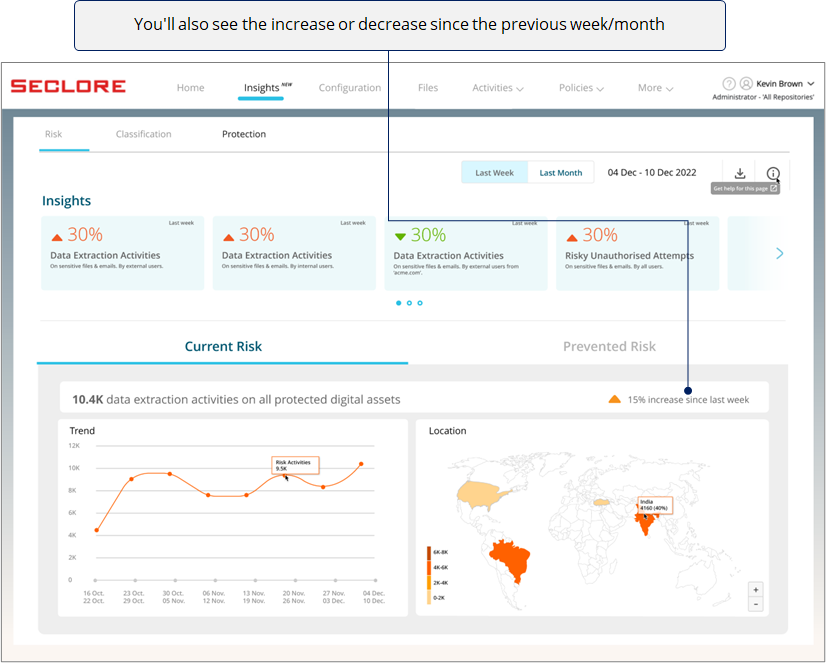
*A sudden spike in a week/month could prompt you to check the events that happened during that time - perhaps you partnered with a new vendor during that period.
![]()
Finally, if you're an organization with offices across the globe, this heat map can be very useful for you.
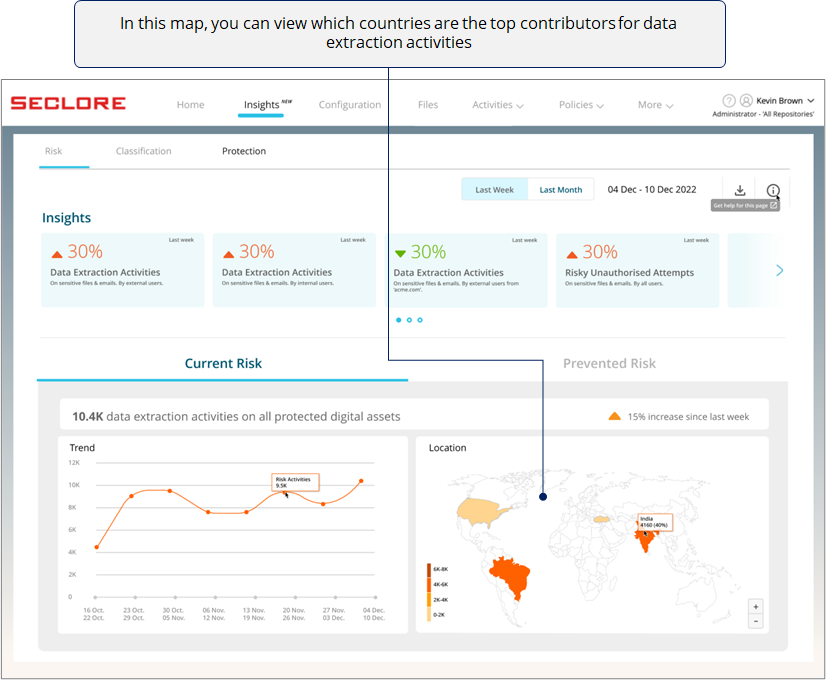
*The heat map could prompt you to check with regional heads if the high volume of data extraction activities in their countries have a valid business need.
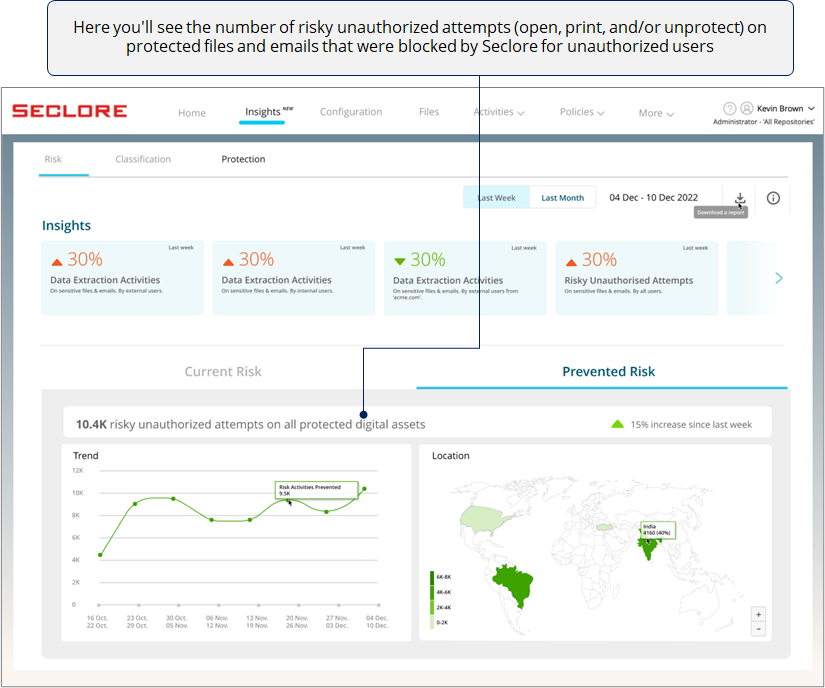
- Now, let's view the Prevented Risk section.
- In this section, you'll see analytics for risky activities prevented by Seclore in the period you've selected.
![]()
![]()
![]()
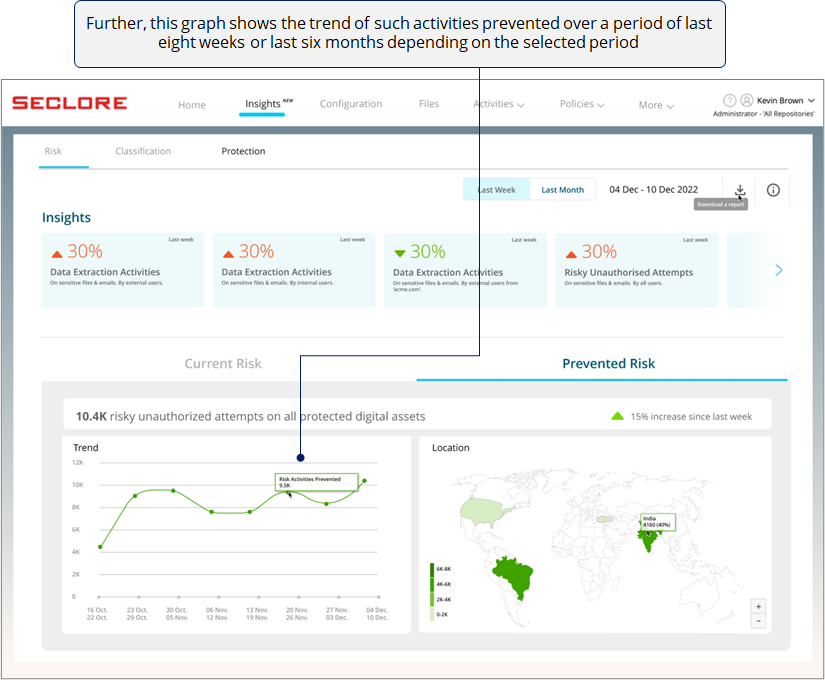
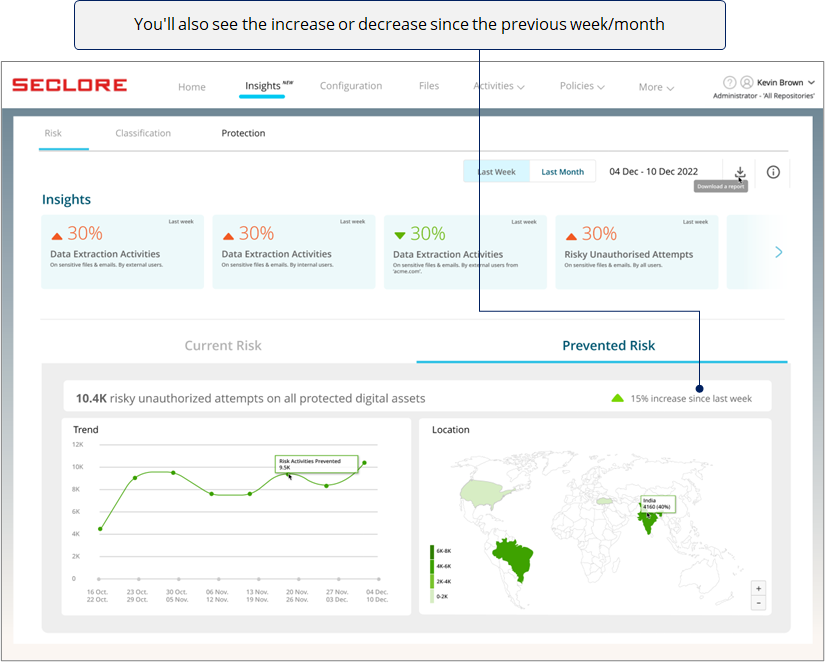
*A sudden spike in a week/month should prompt you to check the events that happened during that time - perhaps authorized users (within or outside your organization) are sharing files and emails with unauthorized parties.
![]()
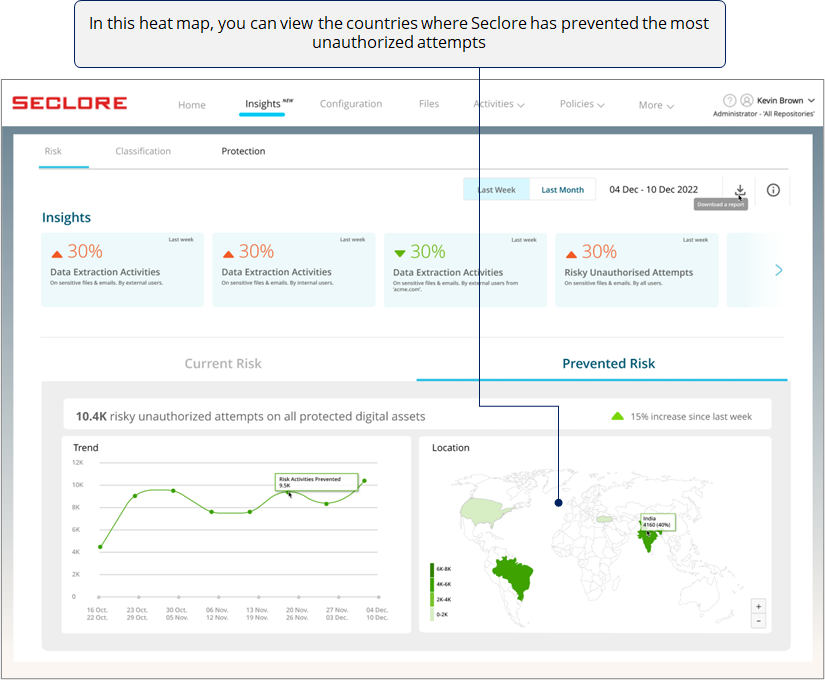
*The heat map could prompt you to check with regional heads if the high volume of risky unauthorized attempts in their country means that a lot of sensitive assets are being shared with unauthorized users.